Is SEO Opportunity Growing or Shrinking?
Rand Fishkin, Moz.com
Related:
It’s our existential question as SEO professionals — is SEO still growing? Or have Google’s actions reduced the opportunity potential? I see this phrased in all sorts of ways:
- Are there more searches on Google this year than last year?
- Is Google taking more of the search traffic for themselves?
- Do more or fewer clicks go to the organic results because Google’s made paid results (or SERP features) more subtle/compelling?
- Is the trendline of SEO opportunity plateauing? Shrinking? How fast?
These are hard questions to answer unless you have a huge amount of data about web searcher behavior. Thankfully, the emergence of clickstream data providers like Jumpshot and SimilarWeb has been a boon to the field, and for the first time, we’ve been able to accurately access real numbers, at scale. While at Moz, I’ve been lucky to work with the team at Jumpshot to get data for presentations that look Inside Google’s Numbers and examine the threat vectors of Google’s Trojan Horsing of the Web.
Today, I’ve got new data to share, courtesy once again of our Jumpshot friends. Their methodology and panels have been updated to get more accurate, and thus some of these numbers should actually replace the data I’ve shown in the past, and help us answer the pressing questions above. Let’s dive in.
First — Jumpshot’s methodology. They collect data via a suite of software programs installed on tens of millions of desktop and mobile devices around the world. Any page a browser requests and visits on one of these machines is recorded, anonymized, and aggregated. Because the size and makeup of their panels fluctuate, they run processes similar to survey analysts or election pollsters to get representative, scaled data. For the dataset presented here, search query numbers come exclusively from Google.com searches in the United States.
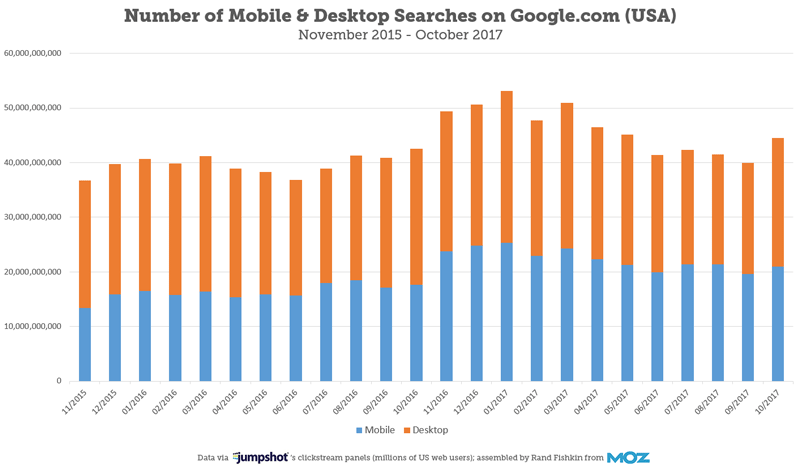
Below is a look at total search volume across the last two years:
Some important points I take away from this graph:
- Seasonality is a big factor, and there’s a spike in searches between October-March each year (more people inside? holidays? cold weather?)
- Year over year, the period of January-October, 2017 has 13.4% more search volume than the same months in 2016
- September 2017 was a little smaller than September 2016, the only year-over-year dip in our chart, but hard to point to as a pattern given October’s recovery
- That 13.4% represents 53.59 Billion more queries, which is just about the total number of searches Google did, worldwide, in my first year in the SEO world (2003)
- While we can’t be sure of the reason, I strongly suspect that big spike starting in November, 2016 and continuing through to March, 2017 was bolstered by the US election
The big story is search is still huge in the US, and still growing at a fast clip. So far, I’m not feeling particularly nervous about SEO opportunity.
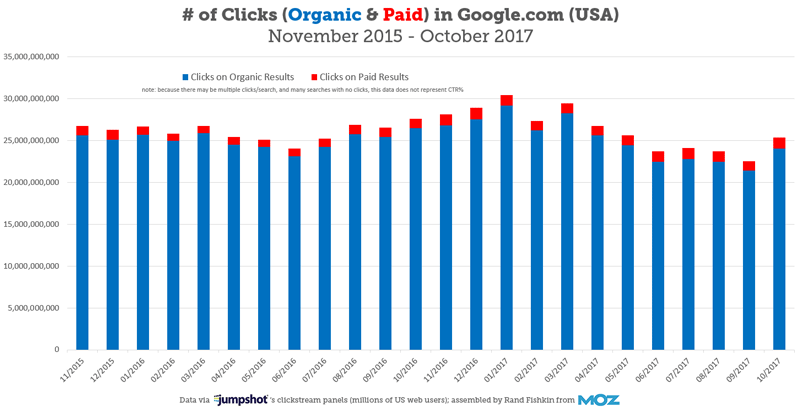
Next, let’s look at organic vs. paid (AdWords) clickthroughs over the same period:
The data here shows us raw clicks, not clickthrough rate. And while the chart looks similar, I have some different takeaways:
- The high point in number of clicks (to both organic and paid results) was in January 2017, but I don’t like the look of the summer and fall of this year
- The four lowest points in the graph are all in the last 6 months (June-September, 2017)
- Seasonality doesn’t explain the drop fully, leading me to think there is somewhat less opportunity to earn clicks in Google now than there was in the time period leading up to this summer
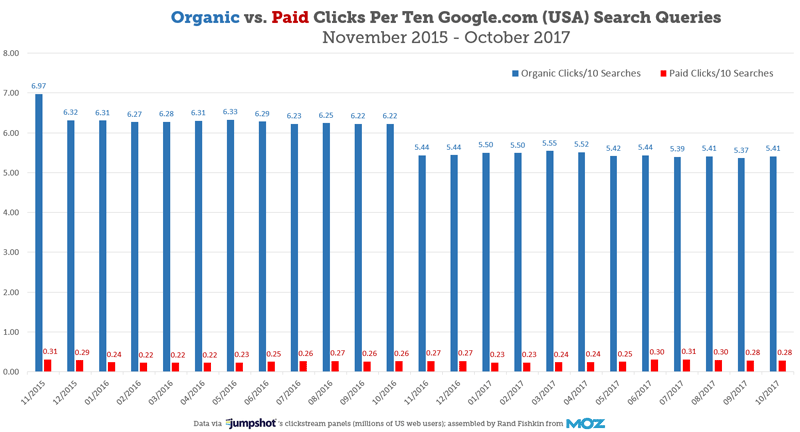
Looking at this graph, I realized I needed another way to visualize the data. I wanted to understand how many clicks per search are happening each month, so I made a new chart that illustrates that trend:
The metric of “clicks / ten search queries” helps us avoid seasonality biases and look instead at the rate of queries that lead to traffic opportunity. Here, the reality is sobering.
- The high point was the first month of the graph, November 2015
- Since then, there have been two significant declines in organic clicks/query (12/2015 and 11/2016) and one significant decline in paid clicks/query (01/2016, though it’s now nearly recovered)
- The 5.41 clicks/10 queries in October, 2017 is 23% lower than the 6.97 clicks/10 queries we had back in November, 2015. That’s a lot of lost SEO opportunity
- I haven’t yet tried to tie the drops back to noted changes in the SERPs, but I suspect the growth in featured snippets, instant answers, and knowledge panels in the results are at least partially responsible
- The growth of search volume has made up for much of the lost click opportunities, but this is a tough trend chart to see as an SEO
- That said, SEO still gets ~20X more traffic than PPC, and it doesn’t cost anything close to as much, so there’s still a massive advantage to ranking organically
My conclusion from this — we’re living in a world with slightly less SEO opportunity and a trendline over the last couple years that worries and frustrates me. Granted, there’s still incredibly more traffic opportunity in Google’s organic results than A) anywhere else on the web B) there was at anytime from 1997-2015 C) there is in AdWords/PPC by a factor of 20X! and D) we can see here because this data is only for the US, and Google’s still growing at a much more rapid pace in many other parts of the world. But, I plan to keep a careful eye on this.
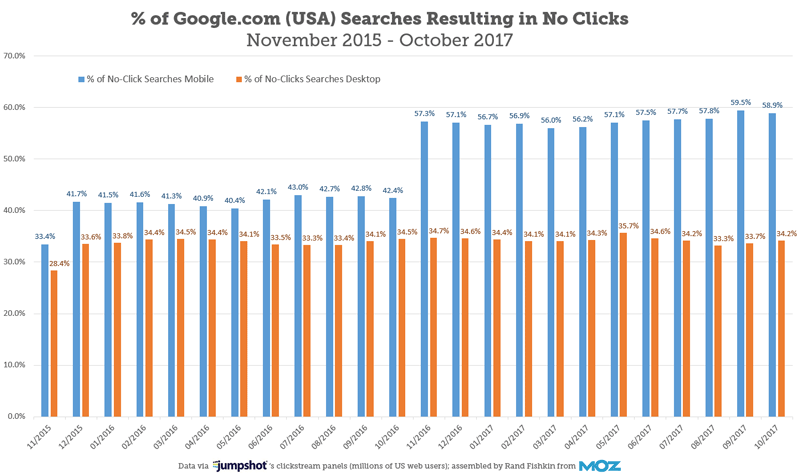
The last chart in my series looks specifically at “no-click” searches, where a query is performed but isn’t followed by a visit to any result. I wanted to see how this tied together with the loss in clicks/query above.
The matching step-growth in mobile, “no-click” searches is uncanny. It aligns almost perfectly with what we saw above in the reduced click/query data, and suggests mobile (at least in the 11/2016 period) was the primary culprit in organic click loss.
For those who might leave this post thinking “oh no, it’s the SEO apocalypse!” please think a little deeper  Mobile clickthroughs to organic results have had a couple sharp step functions down, but Google organic traffic is still the overwhelming driver of visits across the web. Diversifying is smart. Figuring out how to draw more clicks from Google by targeting the right keywords and optimizing your snippets is, too. It’s almost certainly the case that these changes hit some areas (sports scores, questions with short, fact-based answers, weather, distances, measurements, etc) much harder than others.
 Mobile clickthroughs to organic results have had a couple sharp step functions down, but Google organic traffic is still the overwhelming driver of visits across the web. Diversifying is smart. Figuring out how to draw more clicks from Google by targeting the right keywords and optimizing your snippets is, too. It’s almost certainly the case that these changes hit some areas (sports scores, questions with short, fact-based answers, weather, distances, measurements, etc) much harder than others.
My advice is to pay attention to the results you care about, and watch for opportunity to take click-share, expand the types of SERP features you can appear in, and keep an eye on both rankings and traffic for mobile and desktop. Meanwhile, I’ll keep watching the aggregate data with Jumpshot and hope to have more to share on this front soon.
p.s. Jumpshot’s panel of web users fluctuates over time. To account for this, they normalize against the estimated size of the US’ Internet population. That said, their data is limited to mostly desktop, laptop, and Android devices, with less coverage for iOS. So, while we have a great deal of confidence in the numbers thanks to the panel size, accounting for variance and imperfect coverage is wise.
Related:


Comments
Post a Comment